Microsoft Excel: Secrets of Effective Non-Visual Work with Tables
Part 3
Filling Cells with Data
In Excel, there are several techniques for filling cells that facilitate data entry and improve the work process.
In the previous part, we discussed how to fill cells in Excel, techniques that simplify data entry and make the workflow more efficient. Now we continue exploring practical methods to enhance non-visual work with tables.
Manual Cell Filling
This is done by moving through the table and entering information into the corresponding cells. For ease of navigation, arrow keys are used, as well as the “Tab” and “Enter” keys. The “Tab” key is convenient for filling out a row, as it moves the focus to the next cell in the current row to the right of the one being filled. The “Enter” key, in this case, moves the focus to the first cell of a new row below the current one. When using the “Tab” and “Enter” keys in conjunction with the “Shift” key, the movement through the cells is reversed horizontally and vertically, respectively.
Important: do not mix arrow keys with “Tab” and “Enter” keys, as in this case, the “Enter” key will move the focus to the cell below the one being filled in the current column.
Date and Time
When you need to fill a cell with a date, use the combination “Ctrl +;” (semicolon), and to fill a cell with time – “Ctrl + Shift +;” (semicolon). However, note that the cell being filled must have the appropriate format to correctly display the date or time.
Creating a Hyperlink

The “Ctrl + K” key combination allows you to create a hyperlink. In the dialog box, enter the link to the resource or select the object the hyperlink will point to, enter the text, and press “Ok”. To open, use the context menu “Shift + F10” and select “Open Link”. After this, the indicated object will be opened in the corresponding program.
Handling Common Fractions
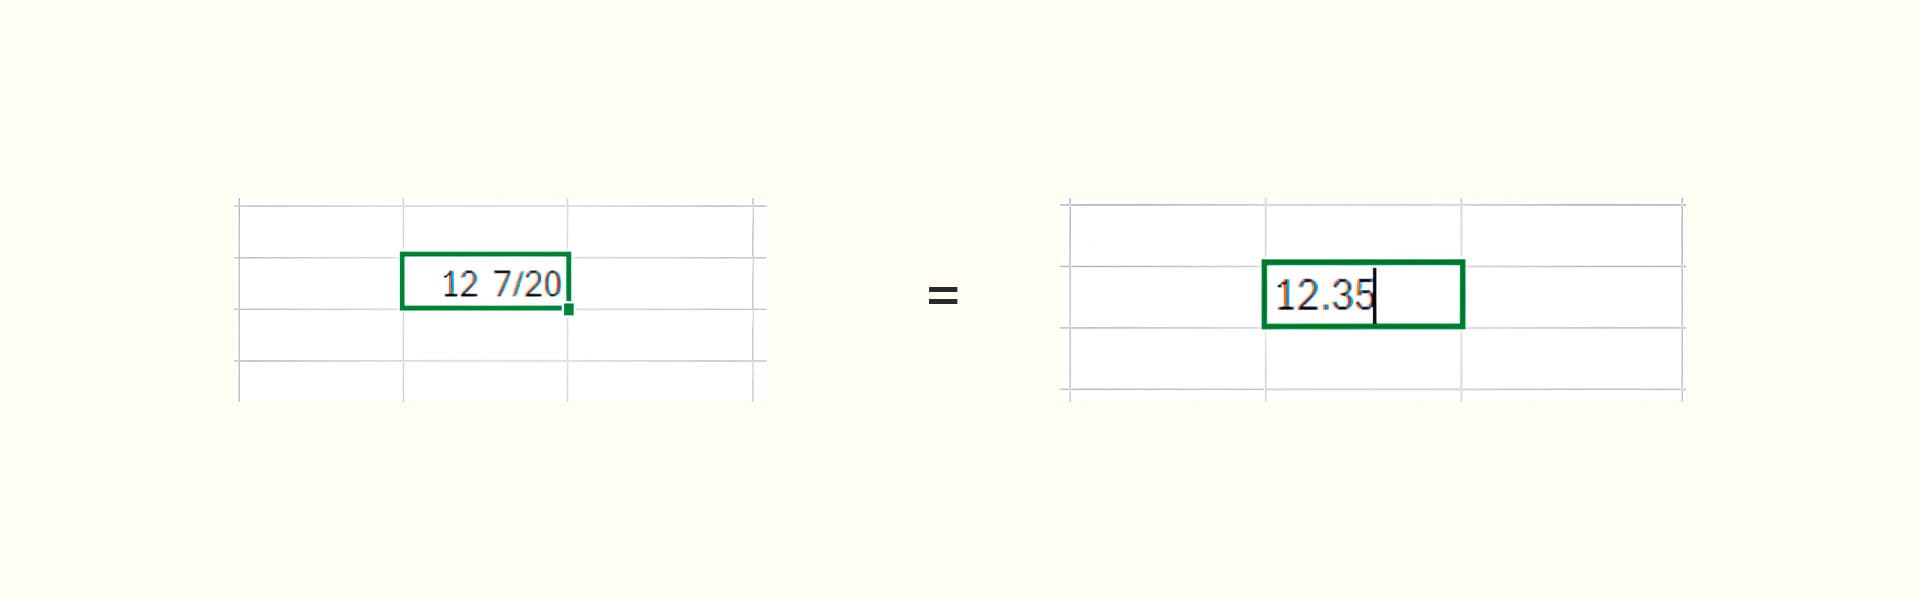
Excel supports working with common fractions, not just decimal ones. For example, you can enter “12 35/100” to represent “twelve and thirty-five hundredths”. The program can perform arithmetic operations and provide results in the format of common fractions.
It’s important to remember that a common fraction consists of a whole and a fractional part. Even if the number has no whole part, it should be indicated by using the number 0. For example, “0 5/10” represents “five tenths”.
Autofill
The “Fill” function is designed for automatically populating cell ranges with specific data or sequences. This feature can be invaluable when you need to quickly create series of numbers, dates, text, or other data.
Here are a few ways to use the “Fill” function in Excel:
To fill with uniform data, such as zeros, highlight the range of cells, then enter the data and use the “Ctrl + Enter” shortcut. The result will be cells filled with zeros in the selected range.
You can also fill a range with progressive data. For example, to fill a range with dates for January, enter the date “01.01.2024” in the first cell of the range, or use the “Ctrl +;” (semicolon) shortcut if you need to fill the range starting from the current date. Then highlight the range of cells to be filled and use the “Ctrl + 1” shortcut to set the cell format to “Date”.
If the range selection is lost, reselect it. After that, on the “Home” tab in the “Editing” group, choose “Fill” and in the pop-up window that appears, select “Series”. In the final step, in the window that opens, specify the step, if necessary – “Stop Value” and “Auto Fill Steps”, then press “Ok”.
The “Autofill” feature is a powerful tool for quickly filling large areas of the table with data without the need to manually enter each cell.
Searching and Sorting

Sorting data in an Excel table is a crucial tool for organizing and arranging information. This process makes it easier to find the needed data and also enhances the visual presentation of information. Here are the steps for sorting data in Excel:
- Select the range of cells you want to sort. This can be the entire table or specific columns.
- Open the context menu with “Shift + F10” and choose “Sort > Custom Sort”. If you need to sort in ascending or descending order, select the corresponding quick sort option.
- In the dialog box that appears, select the column you want to sort by. You can also choose the sort order: ascending or descending.
- If you have additional columns of data, select “Add Level” to add more sorting criteria. This allows you to sort by one column first and then by another.
- Click “OK” to apply the sorting settings. Your data will be automatically organized according to the selected criteria.
To search in Microsoft Excel, the “auto-filter” tool is conveniently used, allowing for easy and quick data filtering in tables. It’s used to display only those rows of data that meet specific criteria, making the analysis and processing of information more efficient. Here’s how to use auto filter in Excel:
- Select a cell in the column you want to filter by. The cell should be in the column where you want to apply the filter. If you have column headers, it’s better to select a cell in the header, and if there’s no header, it’s better to create one first.
- Go to the “Data > Sort & Filter” tab on the ribbon and click the “Filter” button to activate the auto filter.
- Now, after the contents and coordinates, the cell will announce “Dropdown button without applied filter”. To expand the button, use “Alt + Down Arrow”, and to collapse without applying a filter – “Alt + Up Arrow”.
- There are many filters in this list by which you can sift through the data, including sorting and a field to enter a specific value. To apply a filter, use the “Enter” key.
- After applying the filter, all cells with the corresponding results will be displayed below.
Using Formulas
In Microsoft Excel, formulas are a powerful tool for data processing and performing various calculations. Formulas enable the automation of calculations and the performance of complex operations, improving the efficiency of working with spreadsheets.
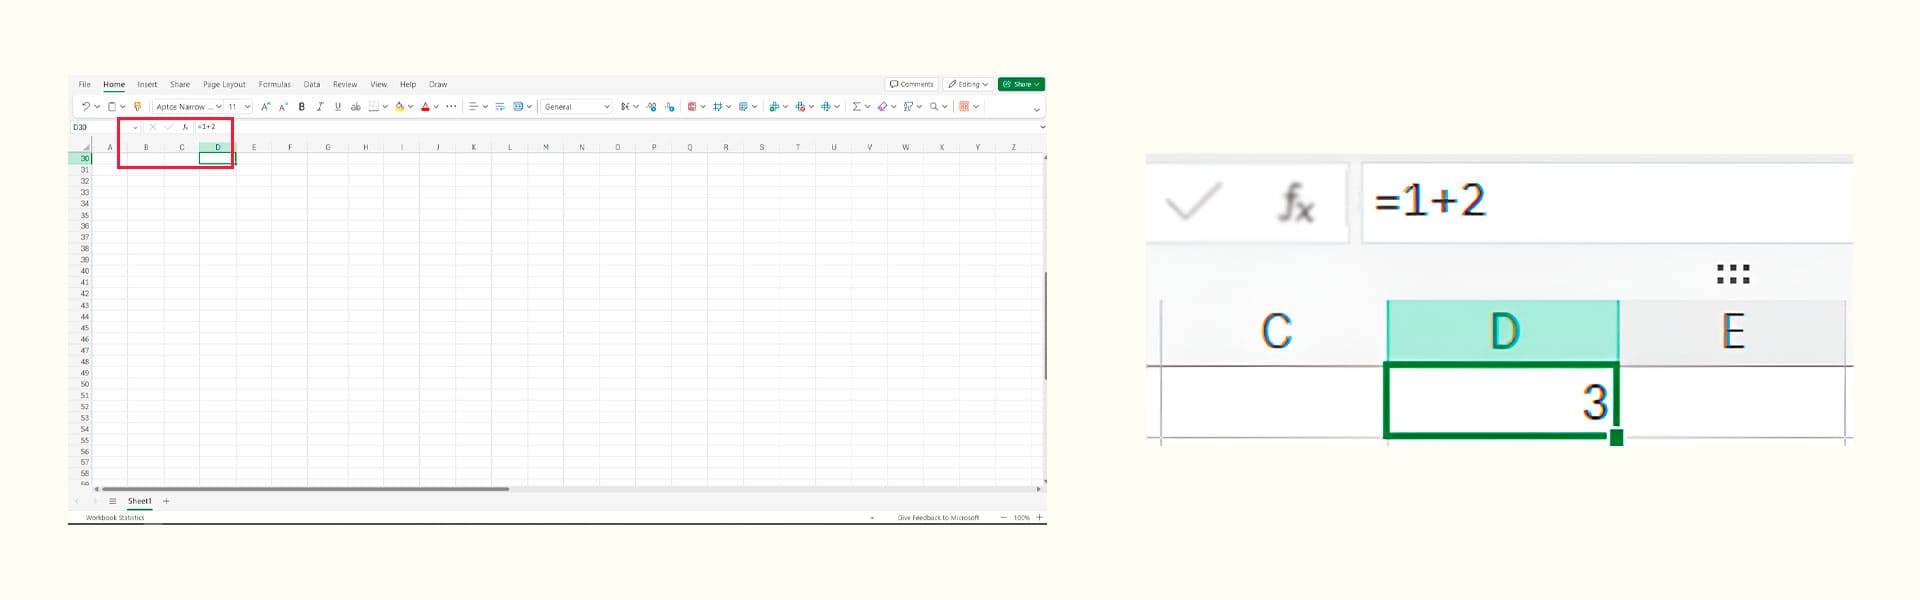
Using any formula starts with the “=” (equals) sign. Here are a few examples of the most common formulas:
- Arithmetic Operations:
- Addition: =1+2 or =A1 + B1
- Subtraction: =2-1 or =A2 – B2
- Multiplication: =2*2 or =A3 * B3
- Division: =6/2 or =A4 / B4
- Statistical Functions:
- Average value: =AVERAGE (A1:A10)
- Sum: =SUM (A1:A10)
- Minimum: =MIN (A1:A10)
- Maximum: =MAX (A1:A10)
- Logical Functions:
- IF: =IF (A5> B5, “Greater”, “Less or Equal”)
- AND: =AND (A6> 0, A6 <10)
- OR: =OR (B6 = “Yes”, B7 = “Yes”)
- Text Functions:
- Concatenate Cells: =CONCATENATE (A8, “…”, B8)
- Find Substring: =SEARCH (“Text to find”, C1)
- Date and time:
- Current date: =TODAY (…)
- Current time: =NOW (…)
- Difference between dates: =DATEDIF (A9, B9, “d”)
This is just a brief overview of the capabilities of formulas in Excel. The application of formulas allows for the automation of routine operations, enhancing accuracy and speeding up the data analysis process in spreadsheets. All formulas can be found in the “Function Library” group on the “Formulas” tab in the ribbon.
A bit about culture
The culture of creating MS Excel spreadsheets implies a few rules:
- Column Titles: It is customary to place the titles of all columns in the first row of the table.
- Row Names: If necessary, to provide names for all rows, the entire first column is filled with row headers.
- Vertical Projection: When using a table as a catalog, it is recommended to structure it in vertical projection, i.e., listing from top to bottom.
- Reading the Table: In general, a table should be read from left to right and top to bottom.
These conventions are not mandatory but are strongly recommended, ensuring a more structured and easily understandable appearance of tables, which is especially important when using Excel in the workplace.
In this article, we’ve finished covering the key aspects of effective non-visual work with tables in Microsoft Excel. However, it’s worth noting that Excel is an amazing tool with rich functionality, and the methods and techniques presented here are just the beginning of your journey to mastery.
There are many additional functions, tools, and features in Excel that can be explored for a deeper understanding and maximum utilization of the program. Additional aspects, such as macros, pivot tables, offer vast opportunities for optimizing workflow and data analysis.